Jambmaths
| Maths Question | |||||||||||||||||||
|---|---|---|---|---|---|---|---|---|---|---|---|---|---|---|---|---|---|---|---|
| Question 41 |
A dice is rolled 240 times and the result depicted in the table above. If a pie chart is constructed to represent the data, the angle corresponding to 4 is |
||||||||||||||||||
| Question 42 |
The table above shows the frequency distribution of ages (in years) of pupils in a certain secondary, what percentage of the total number of pupils is over 15 but less than 21 years |
||||||||||||||||||
| Question 43 |
The table above shows the frequency distribution of ages (in years) of pupils in a certain secondary The cumulative frequency curve above represent the ages of students in a school which age group do 70% of the students belong |
||||||||||||||||||
| Question 44 |
Find the sum of the range and mode of the set of numbers 10,5, 10, 9,8, 7,7,10, 8,10, 8,4, 6,9,10,9,10,9,7,10,6,5. |
||||||||||||||||||
| Question 45 |
If the mean of number 0, x, x + 2, 3x + 6, and 4x + 8 is 4. Find the mean deviation |
||||||||||||||||||
| Question 46 |
The variance of x, 2x, 3x, 4x and 5x is |
||||||||||||||||||
| Question 44 |
The graph above shows the cumulative frequency of the distribution of Masses of fertilizer for 48 workers in one institution. Which of the following gives interquartile range. |
||||||||||||||||||
| Question 45 |
|
||||||||||||||||||
| Question 47 |
Find the variance of 2,6,8,6,2 and 6 |
||||||||||||||||||
| Question 48 |
The bar chart above shows different colours of cars passing a particular point on a certain street in two minutes. What fraction of the total number is yellow. |
||||||||||||||||||
| Question 50 |
Find the range ${\scriptstyle{}^{1}\!\!\diagup\!\!{}_{6}\;},{\scriptstyle{}^{1}\!\!\diagup\!\!{}_{3}\;},{\scriptstyle{}^{3}\!\!\diagup\!\!{}_{2}\;},{\scriptstyle{}^{8}\!\!\diagup\!\!{}_{9}\;}\text{ and }{\scriptstyle{}^{4}\!\!\diagup\!\!{}_{3}\;}$ |
||||||||||||||||||
| Question 42 |
Find the mean of the data 7, –3, 4, –2, 5, –9, 4, 8, –6, 12, |
||||||||||||||||||
| Question 44 |
The range of the data k + 2, k – 3, k + 4, k – 2, k, k – 5, k + 3, k – 1 and k + 6 |
||||||||||||||||||
| Question 46 |
The acre for rice, pineapple, cassava, cocoa and palm oil in a certain district are given respectively as 2, 5, 3, 11 and 9. What is the angle of the sector for cassava in a pie chart |
||||||||||||||||||
| Question 48 |
The mean of a set six number is 60. If the mean of the first five is 50. Find the sixth number in the set. |
||||||||||||||||||
| Question 49 |
Calculate the mean deviation of the set of numbers 7, 3, 14, 9, 7, and 8 |
||||||||||||||||||
| Question 50 |
The distribution above shows the number of daysa group of 260 students were absent from school in a particular term. How many students were absent for at least four days in the term? |
||||||||||||||||||
| Question 40 |
By how much is the mean of 30, 56, 31, 55, 43, and 44 less than the median? |
||||||||||||||||||
| Question 41 |
The range of 4, 3 11, 9, 6, 15, 19, 23, 27, 24, 21 and 16 is |
||||||||||||||||||
| Question 42 |
Find the mean of the distribution above |
||||||||||||||||||
| Question 43 |
On a pie chart, there are four sector of which three angles are 45o, 90o, and 135o. If the smallest sector represent N28.00. How much is the largest sector. |
||||||||||||||||||
| Question 47 |
The mean of the numbers 3, 6, 4,x, and 7 is 5. Find the standard deviation. |
||||||||||||||||||
| Question 48 | |||||||||||||||||||
| Question 49 |
|
||||||||||||||||||
| Question 50 |
The result of tossing a fair die 120 times is summarized above. Find the value of x
|
||||||||||||||||||
| Question 19 |
Find the mean deviation of 1, 2, 3 and 4 |
||||||||||||||||||
| Question 21 |
The pie chart above the distribution of the crops harvested from a farmland in al year. If 3000 tonnes of millet is harvested, what amount of beans is harvested? |
||||||||||||||||||
| Question 23 |
The mean age of a group of students is 15 years. When the age of a teacher is 45years old is added to the ages of the students, the mean of their ages becomes 18 years. Find the number of students in the group. |
||||||||||||||||||
| Question 26 |
The weight of 10 pupils in a class are 15kg, 16kg, 17kg, 18kg, 16kg, 17kg, 17kg, 17kg,18kg and 16kg. What is the range of this distribution? |
||||||||||||||||||
| Question 27 |
I. Rectangular bars of equal width |
||||||||||||||||||
| Question 31 |
The table above shows the score of a group of students in a test. If the average is 3.5, find the value of x |
||||||||||||||||||
| Question 33 |
Find the value of t if the standard deviation of 2t, 3t, 4t, 5t, and 6t is $\sqrt{2}$ |
||||||||||||||||||
| Question 34 |
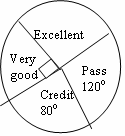
The grade of 36 students in a test shown in the pie chart . How many students had excellent? |
||||||||||||||||||
| Question 36 |
The modal height and range of height 1.35, 1.25, 1.35,. 1.25, 1.40, 1.35, 1.45, 1.50, 1.35, 1.50 and 1.20 are m and r respectively. Find m + 2r |
||||||||||||||||||
| Question 38 |
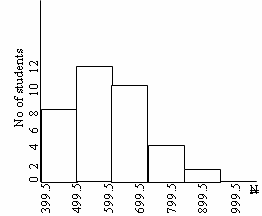
The histogram above shows the distribution of the monthly income of the workers in a company. How many workers earn more than N700.00? |
||||||||||||||||||
| Question 17 |
The table above shows the score of a group of students in a physics test. If the mode is m and the number of students who scored 4 or more is n. What is (n, m)? |
||||||||||||||||||
| Question 19 |
The response of 160 pupils in a school asked to indicate their favorite subjects is given in the bar chart above. What percentage of the pupils has English and Health Education as their favorite subjects? |
||||||||||||||||||
| Question 22 |
The pie chart above show the expenditure of a family whose income sN30,000, if the expenditure on food is twice that on housing and that school fee is twice that on transport, how much the family spends on food? |
||||||||||||||||||
| Question 23 |
Find the variance 2x, 2x – 1 and 2x + 1 |
||||||||||||||||||
| Question 24 |
If the mean of five consecutive numbers integer is 30. Find the largest of the number |
 The histogram above shows the distribution of passengers in taxis of a certain motor park. How many taxis have more than 4 passengers?