Jambmaths
| Maths Question | |||||||||||||||||||
|---|---|---|---|---|---|---|---|---|---|---|---|---|---|---|---|---|---|---|---|
| Question 41 |
The table above gives the frequency distribution of marks obtained a group of students in a test. If the total mark scored is 200. Calculate the value of y |
||||||||||||||||||
| Question 42 |
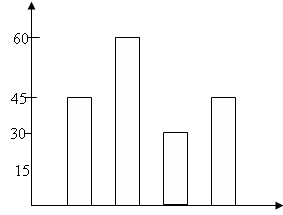
The histogram above represented the weight of students who travelled out of their school for an examination. How many people made the trip. |
||||||||||||||||||
| Question 43 |
The pie chart above illustrate the amount of private time a student spends in a week studying various subjects. Find the value of k |
||||||||||||||||||
| Question 44 |
The cumulative frequency for $5\le x\le 12$from the distribution above is |
||||||||||||||||||
| Question 45 |
If 5, 8, 6and 2 occur with frequencies 3, 2, 4 and 1, respectively, find the product of the modal and median number |
||||||||||||||||||
| Question 46 |
What is mean deviation of 3, 5, 8, 11, 12 and 21? |
||||||||||||||||||
| Question 40 |
On a pie chart, there are six sectors of which four are 30o, 45o, 60o, 90o and the remaining two angles are in ration 2:1. Find the smaller angles of the remaining two angles |
||||||||||||||||||
| Question 42 |
The bar chart above shows the number of times the words a, and, in, it, to appear in the paragraph in a book. What is the ratio of the least frequent word to that of the most frequent word. |
||||||||||||||||||
| Question 43 |
What is the mean of the data $t,2t-1,t-2,2t-1,4t\text{ and }2t+2$ |
||||||||||||||||||
| Question 45 |
Find the median of 4, 1, 4, 1, 0, 4, 4, 2 and 0 |
||||||||||||||||||
| Question 46 |
Find the mean deviation of 2, 4, 5 and 9 |
||||||||||||||||||
| Question 41 |
The distribution above shows the number of days a group of 260 students were absent from school in a particular term. How many students were absent for at least four days in the term? |
||||||||||||||||||
| Question 42 | |||||||||||||||||||
| Question 43 |
The pie chart above represents 400 fruit in display in a grocery store. How many apples are in the store?
|
||||||||||||||||||
| Question 44 | |||||||||||||||||||
| Question 45 |
5, 8, 6 and k occur with frequencies 3, 2, 4 and 1 respectively and have a mean of 5.7. Find the value of k |
||||||||||||||||||
| Question 46 |
What is the mean deviation of x , 2x, x +1, and 3x, if the mean is 2 |
||||||||||||||||||
| Question 45 |
From the table above, if the pass mark is 5, how many students failed the test? |
||||||||||||||||||
| Question 47 |
Use the table below to answer question
Find the mean mark |
||||||||||||||||||
| Question 48 |
Find the standard deviation 2, 3, 5 and 6. |
||||||||||||||||||
| Question 41 |
The pie chart above shows the distribution of courses offered by students. What percentages of the students offer English? |
||||||||||||||||||
| Question 42 |
The bar chart above shows the distribution of SS2 students in a school. Find the total number of students. |
||||||||||||||||||
| Question 44 |
From the table above, find the median and range of the data respectively |
||||||||||||||||||
| Question 45 |
Find the mode of the above distribution |
||||||||||||||||||
| Question 46 |
Find the standard deviation of the above distribution |
||||||||||||||||||
| Question 41 |
The grades of 36 students in a class test are as shown in the pie chart above. How many students have excellent? |
||||||||||||||||||
| Question 42 |
The bar chart above shows the distribution of marks in a class test. If the pass mark is 5, what percentage of the students failed the test? |
||||||||||||||||||
| Question 43 |
The mean of seven numbers is 96. If an eight number is added, the mean becomes 112. Find the eighth number. |
||||||||||||||||||
| Question 44 |
Find the median of 2, 3, 7, 3, 4, 5, 8, 9, 9, 4, 5,3, 4, 2, 4 and 5 |
||||||||||||||||||
| Question 45 |
Find the range of 4, 9, 6, 3, 2, 8, 10 and 11 |
||||||||||||||||||
| Question 46 |
46 Find the standard deviation of 2, 3, 8, 10 and 12 |
||||||||||||||||||
| Question 40 |
The bar chart above shows the allotment of time (in minutes) per week for selected subjects in a certain school. What is the total time allocated to the six subject per weeks? |
||||||||||||||||||
| Question 42 |
$\begin{align} & \text{Find the mean of }t+2,2t-4,3t+2\text{ and }2t \\ & (A)\text{ }t\text{ }(B)\text{ }t+1\text{ }(C)\text{ }2t\text{ }(D)\text{ }2t+1 \\\end{align}$ |
||||||||||||||||||
| Question 43 |
The mean of seven numbers is 10. If six of the numbers are 2, 4, 8,16 and 18. Find the mode. |
||||||||||||||||||
| Question 44 |
Calculate the median age of the frequency distribution in the table above.
|
||||||||||||||||||
| Question 45 |
$\begin{align} & \text{If the variance }3+x,6,4,x,7-x\text{ is 4 and the mean is 5, find the standard deviation} \\ & (A)\text{ }\sqrt{2}\text{ (B) }\sqrt{3}\text{ (C) }2\text{ }(D)\text{ }3 \\\end{align}$ |
||||||||||||||||||
| Question 46 |
The table above shows the scores of 20 students in Further Mathematics test. What is the range of the distribution |
||||||||||||||||||
| Question 43 |
The pie chart above shows the monthly distribution of a man’s salary on food items. If he spent N8000 on rice, how much did he spend on yam? |
||||||||||||||||||
| Question 44 |
The mean of 2 – t, 4 – t, 3 – 2t, 2 + t and t –1 is |
||||||||||||||||||
| Question 45 |
Find the mode of the distribution above |