Jambmaths
| Maths Question | |||||||||||||||||
|---|---|---|---|---|---|---|---|---|---|---|---|---|---|---|---|---|---|
| Question 46 |
Find the median of 5, 9, 1, 10, 3, 8, 9, 2, 4, 5, 5, 7, 3 and 6 |
||||||||||||||||
| Question 47 |
Calculate the standard deviation of 5, 4, 3, 2 and 1 |
||||||||||||||||
| Question 10 |
The distribution of scores in a class test are as follows: 2,8, 6,5, 8, 6, 6, 5, 6 and 5. Find the product of the modal and median score. |
||||||||||||||||
| Question 20 |
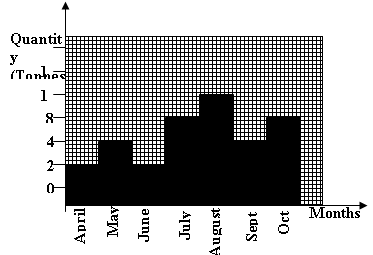
The histogram above shows the number of tons of rice produced. What was the quantity produced from May to September? |
||||||||||||||||
| Question 25 |
Find the median of 5,9,1, 10,3, 8, 9, 9, 2, 4, 5,5, 5,7, 3 and 6 |
||||||||||||||||
| Question 28 |
The pie chart above shows the sectoral allocation of fruits. Find the allocation of oranges. |
||||||||||||||||
| Question 34 |
The scores of ten students in a mathematics test with an average score of 10 are 12, 15, 3, 4, 2x, 8, 10, 13, x and 17. Calculate the value of x |
||||||||||||||||
| Question 38 |
The distribution above shows the ages of 120 children. Find the value of x |
||||||||||||||||
| Question 2 |
If the mean of 4, y, 8 and 10 is 7. Find y |
||||||||||||||||
| Question 14 |
|
||||||||||||||||
| Question 15 |
Calculate the range 20, –6, 25, 30, 21, 28, 32, 33, 34, 5, 3, 2, and 1 |
||||||||||||||||
| Question 16 |
The bar chart above shows the number of visitors received in a week. How many visitors were received on Friday, Tuesday and Sunday? |
||||||||||||||||
| Question 19 |
The table above show the frequency distribution of marks obtained by a group of students. If the total marks is 48, find the value of y |
||||||||||||||||
| Question 26 |
From the table above, find the median |
||||||||||||||||
| Question 32 |
The mean of 2– t, 4+t, 3 –2t, 2+t and t –1 |
||||||||||||||||
| Question 45 |
Find the mean of 10, 8, 5, 11, 12, 9, 6, 3, 15, and 23 |
||||||||||||||||
| Question 47 |
OGIVE is constructed using |
||||||||||||||||
| Question 49 |
The bar chart above shows the marks obtained by students in a mathematics test How many students in all took the test |
||||||||||||||||
| Question 50 |
The bar chart above shows the marks obtained by students in a mathematics test Determine the mean score of the students that took the mathematics test |
||||||||||||||||
| Question 2 |
Find the range of 2, 6, 8, 10 25 3, 4, and 32 |
||||||||||||||||
| Question 5 |
The histogram above shows the number of participant in a meeting from Monday to Friday. How many participated on Monday, Wednesday and Thursday? |
||||||||||||||||
| Question 22 |
Find the mode of the distribution
|
||||||||||||||||
| Question 24 |
Find the mean of the distribution
|
||||||||||||||||
| Question 38 |
The bar chart above is a representation of a candidate’s scores in UTME in 2014, find his total scores |
||||||||||||||||
| Question 1 |
The variance of 3, 2, 3, 6, 2, 4, 4 and 8 is |
||||||||||||||||
| Question 23 |
|
||||||||||||||||
| Question 24 |
|
||||||||||||||||
| Question 4 |
The table above shows the number of pupils in a class with respect to their ages. If a pie chart is constructed to represent the age, the angle corresponding to 8 years old is |
||||||||||||||||
| Question 14 |
Find the mean of the data |
||||||||||||||||
| Question 15 |
Use the table below to answer question 14 and 15
Find the variance |
||||||||||||||||
| Question 20 |
The marks scored by 30 students in a Mathematics test are recorded in the table below:
What is the total number of marks scored by the children? |
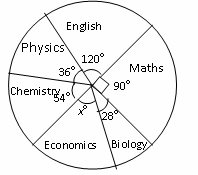 The pie chart above shows the distribution of subjects offered by students in SSSIII level. If 80 students enrolled in the class, what is the size of the angle of the sector in Economics?
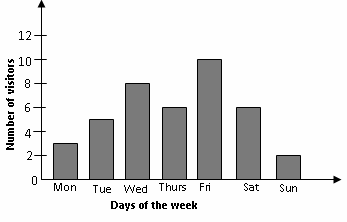


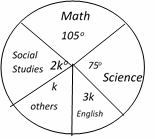 The pie chart above illustrates the amount of private time a student spends in a week studying various subjects. Find the value of k
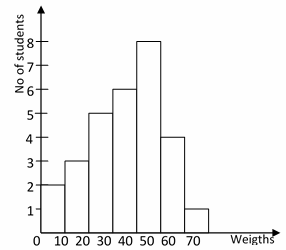 The histogram above represented the weight of students who travelled out of their school for an examination. How many people made the trip.
Pages
- « first
- ‹ previous
- 1
- 2
- 3