Question 40
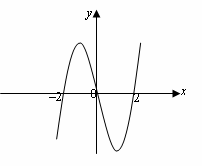
The diagram above is the graph of the function f(x). Determine the range of values of x for which $f(x)\le 0$
The diagram above is the graph of the function f(x). Determine the range of values of x for which $f(x)\le 0$
Divide $6{{x}^{2}}-13x\text{ by }2x-1$
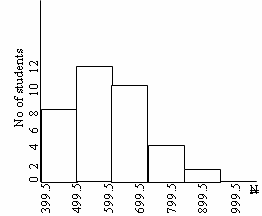
The histogram above shows the distribution of the monthly income of the workers in a company. How many workers earn more than N700.00?
How many possible ways are there of seating seven people P,Q ,R ,S ,T, U and V at circular table
The modal height and range of height
1.35, 1.25, 1.35,. 1.25, 1.40, 1.35, 1.45, 1.50, 1.35, 1.50 and 1.20 are m and r respectively. Find m + 2r
What is the probability that an integer x $(1\le x\le 20)$chosen at random is divisible by both 2 and 3
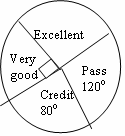
The grade of 36 students in a test shown in the pie chart . How many students had excellent?
Find the value of t if the standard deviation of 2t, 3t, 4t, 5t, and 6t is $\sqrt{2}$
A box contains 5blue balls, 3 red balls and 2 white balls. Two balls were selected from the box with replacement. Find the probability of obtaining two blue or two red balls
|
Scores |
1 |
2 |
3 |
4 |
5 |
6 |
|
No of students |
1 |
4 |
5 |
6 |
x |
2 |
The table above shows the score of a group of students in a test. If the average is 3.5, find the value of x